Structured transaction data supports historical reporting and a forward-looking P&L outlook.
Public project | Excel automation
Automated P&L Model and Dashboard
An Excel application that converts user-entered or system-exported transactions into a structured profit and loss statement, configurable financial model, and executive dashboard.
Onboarding, settings, model creation, formulas, and formatting are handled through workbook controls.
The model produces financial statements, profitability metrics, growth measures, and a visual summary.
Overview
From transactions to a repeatable financial model
The project was built to reduce the recurring work required to create a P&L statement. It can support business financials, personal finance, or individual project P&Ls. Data can be entered directly or sourced from an ERP export, and both actual and forecast transactions can be included in the same model.
Guided workbook experience
The Welcome button launches a custom VBA sequence that moves the user into the transaction workflow and presents a guided tutorial. The workbook is designed so a user can understand the required inputs before building the model.
Transaction structure
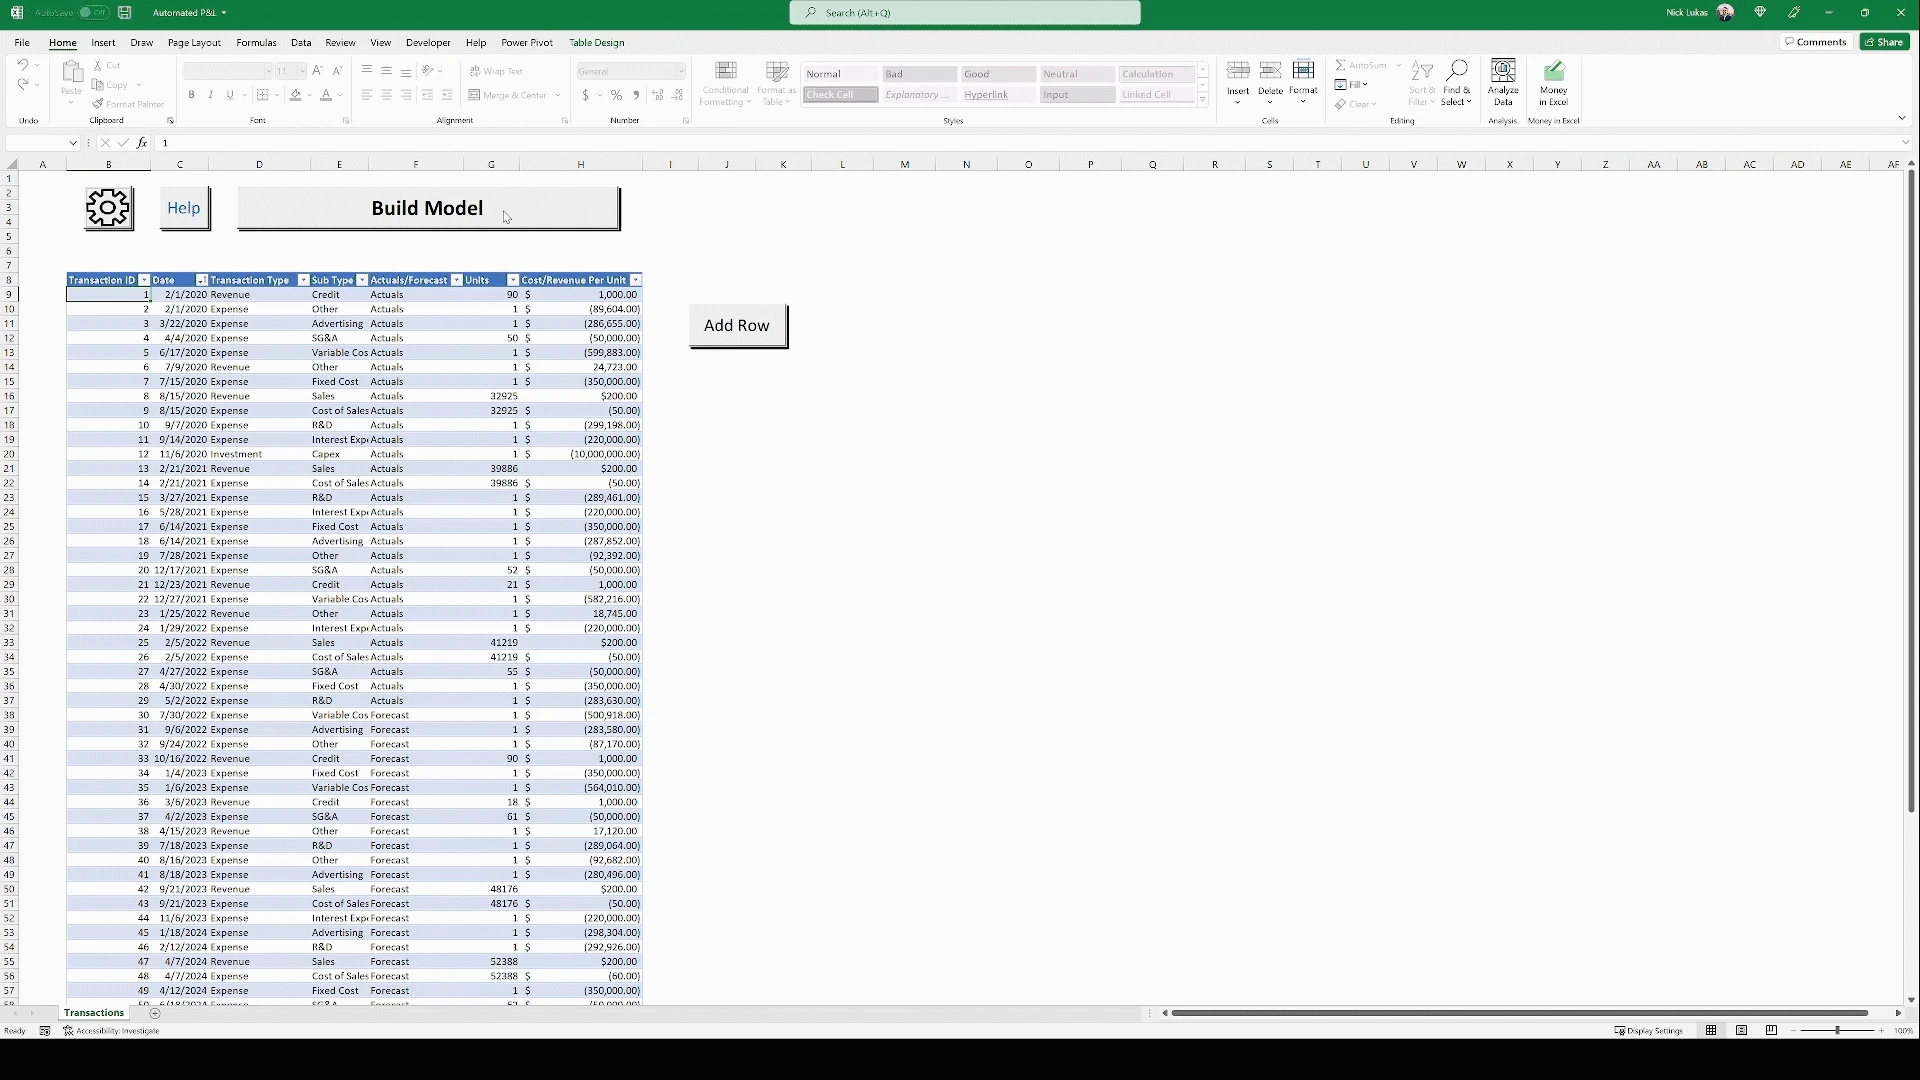
The input table captures transaction ID, date, transaction type, sub-type, actual or forecast classification, units, and cost or revenue per unit. The structured table allows new rows to be added before the model is rebuilt.
Settings and model flexibility
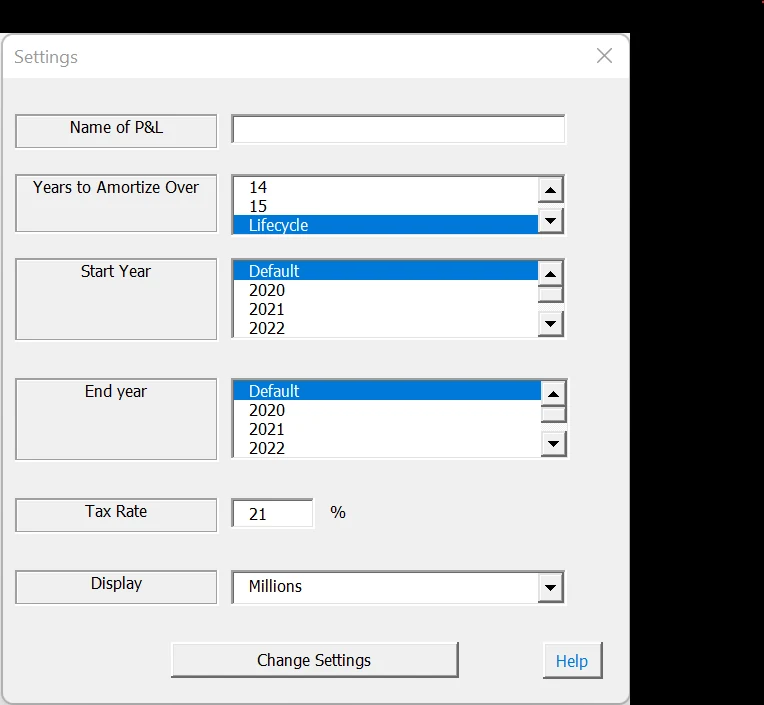
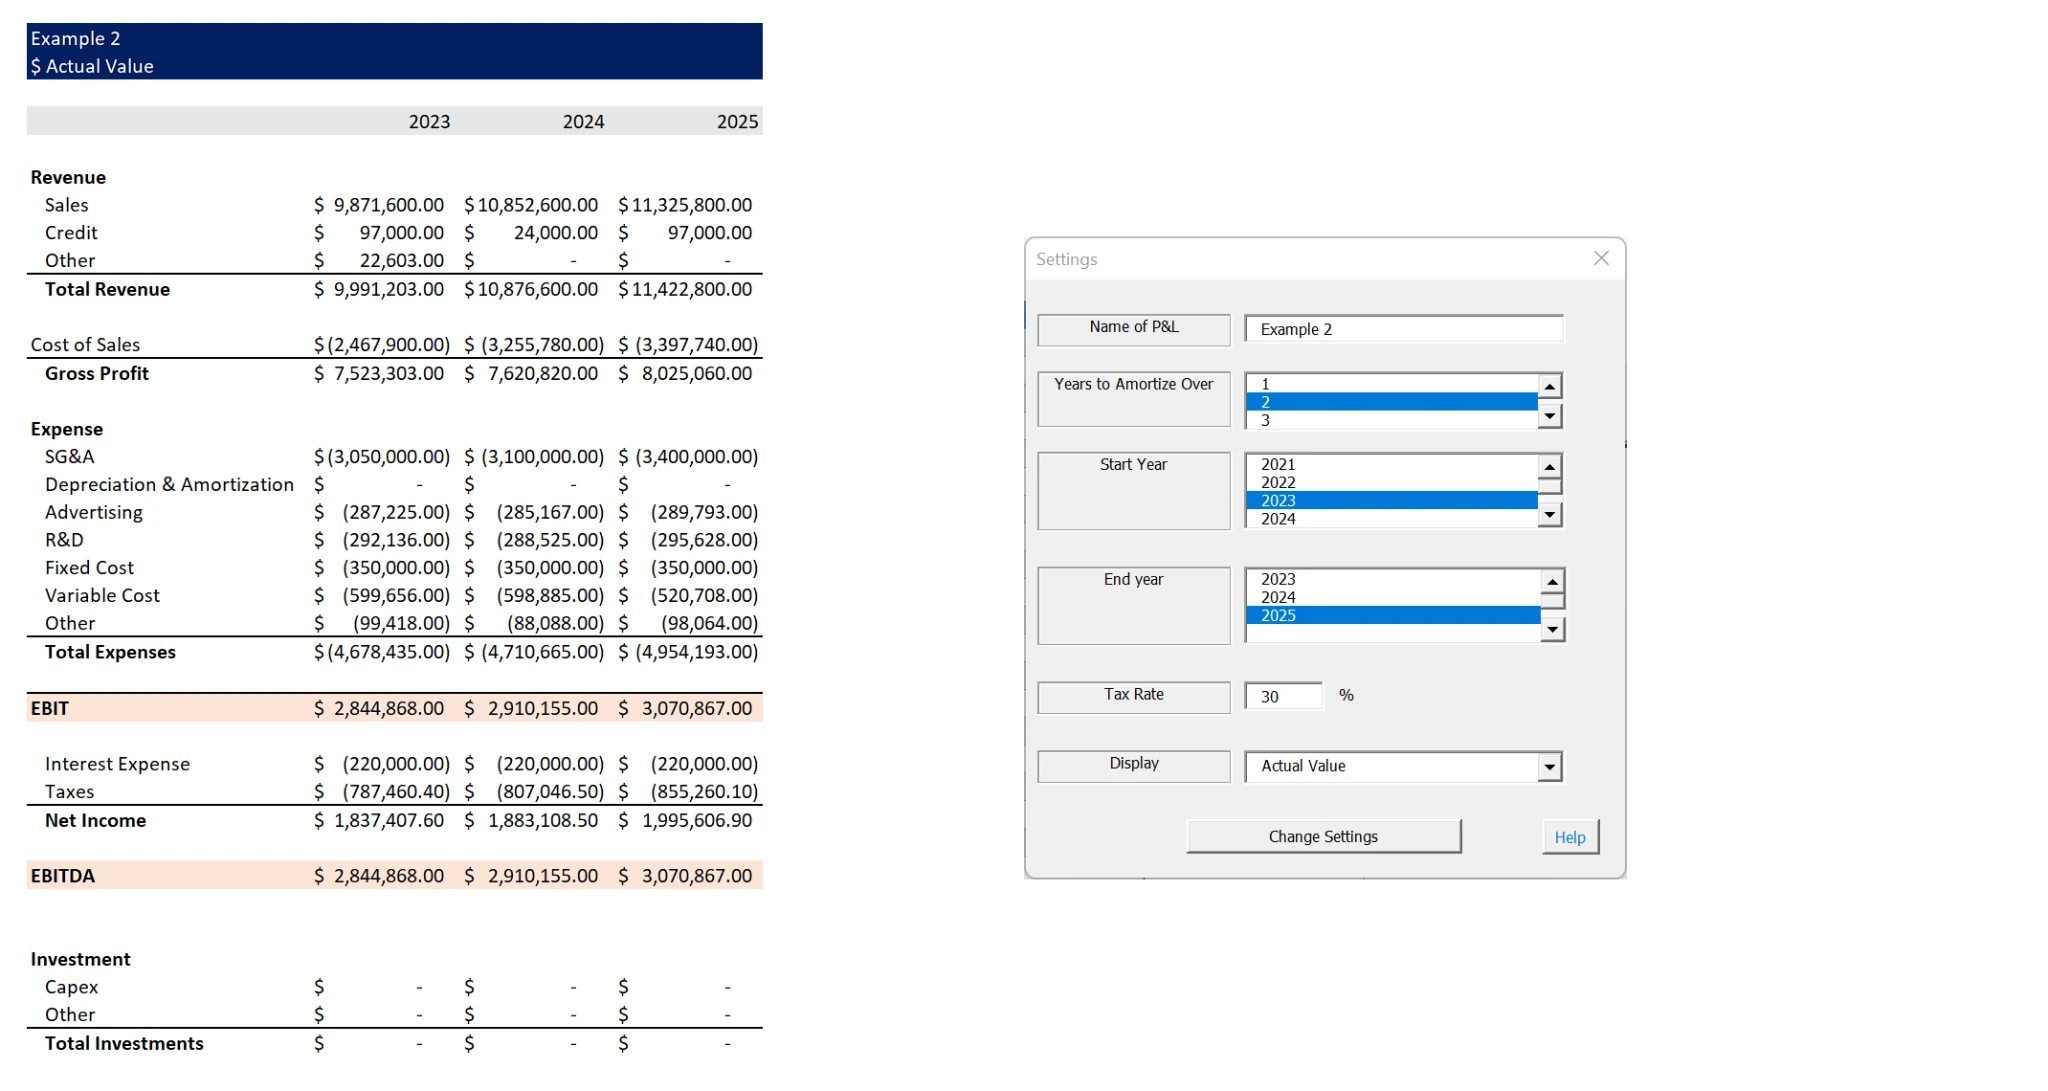
The settings form lets the user define the model name, start and end years, years to amortize an investment or use a lifecycle treatment, tax rate, and whether results display as actual values, thousands, or millions.
Generated financial output
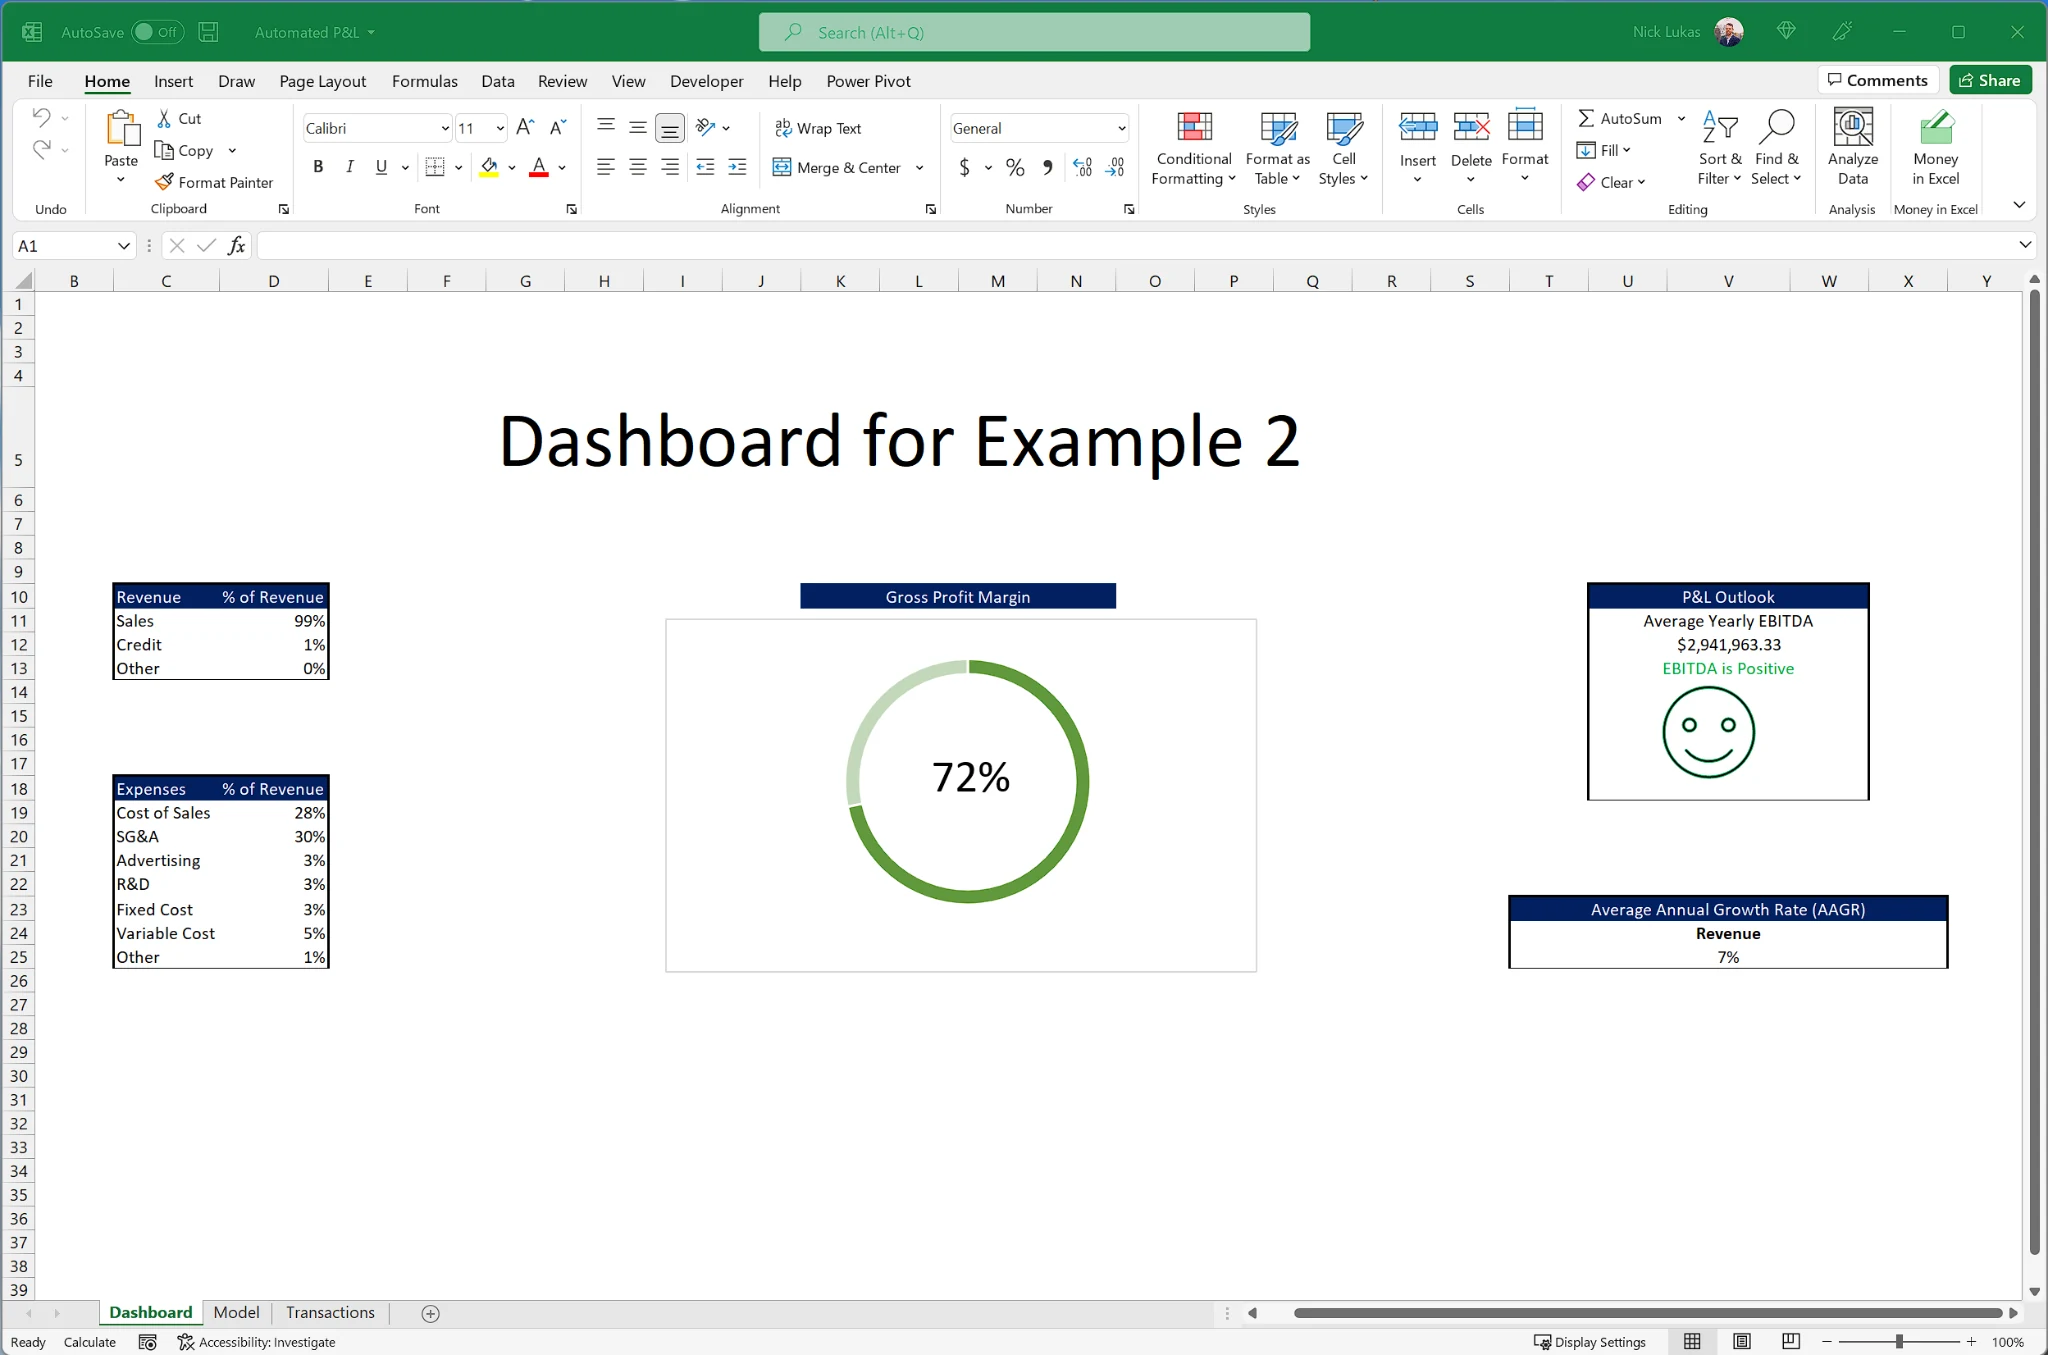
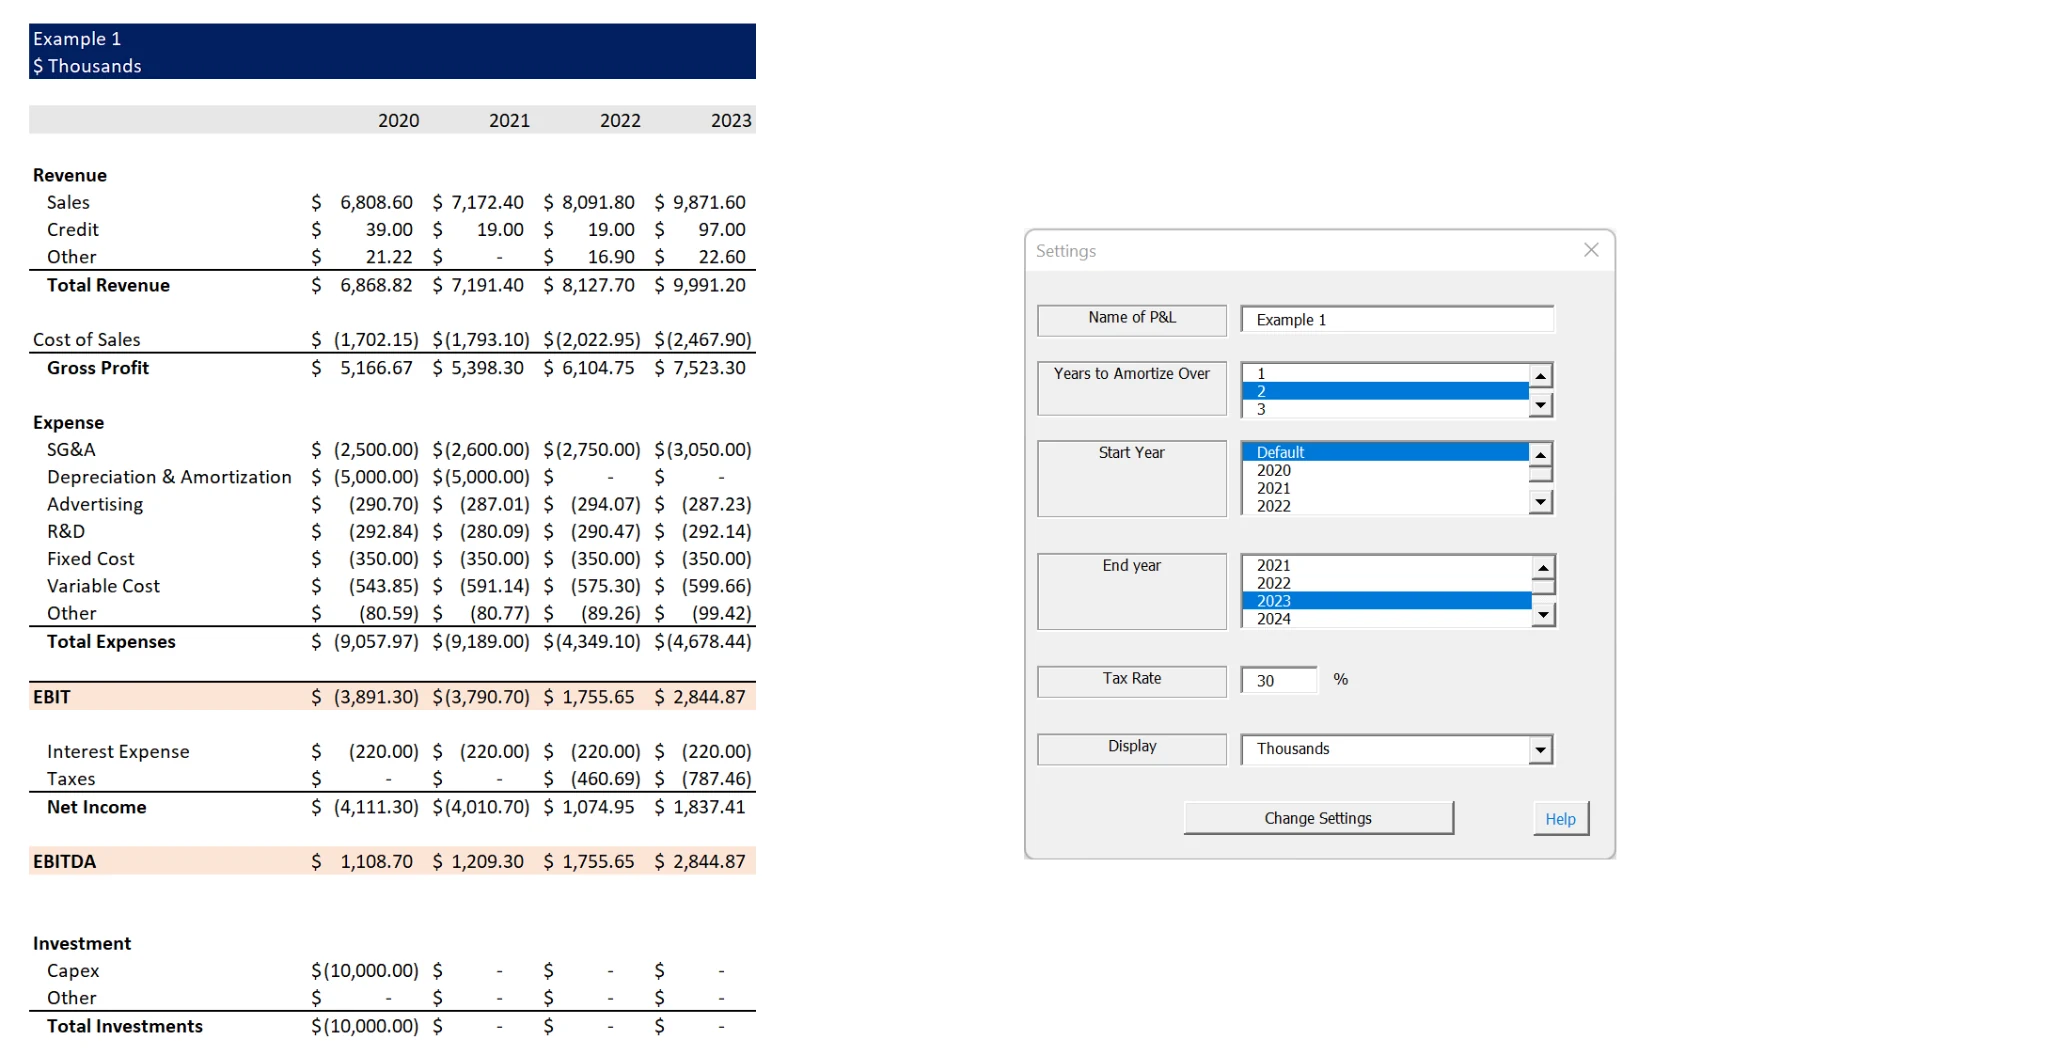
The model organizes revenue, cost of sales, gross profit, operating expenses, EBIT, interest expense, taxes, net income, EBITDA, and investment activity. The dashboard summarizes gross margin, average annual growth, and the overall EBITDA outlook.
Technical implementation
The published workbook uses Excel and VBA for broad compatibility. User forms manage settings and navigation, workbook modules handle model creation, and sheet-level VBA supports the interface.
Product walkthrough
Workbook screens and generated output