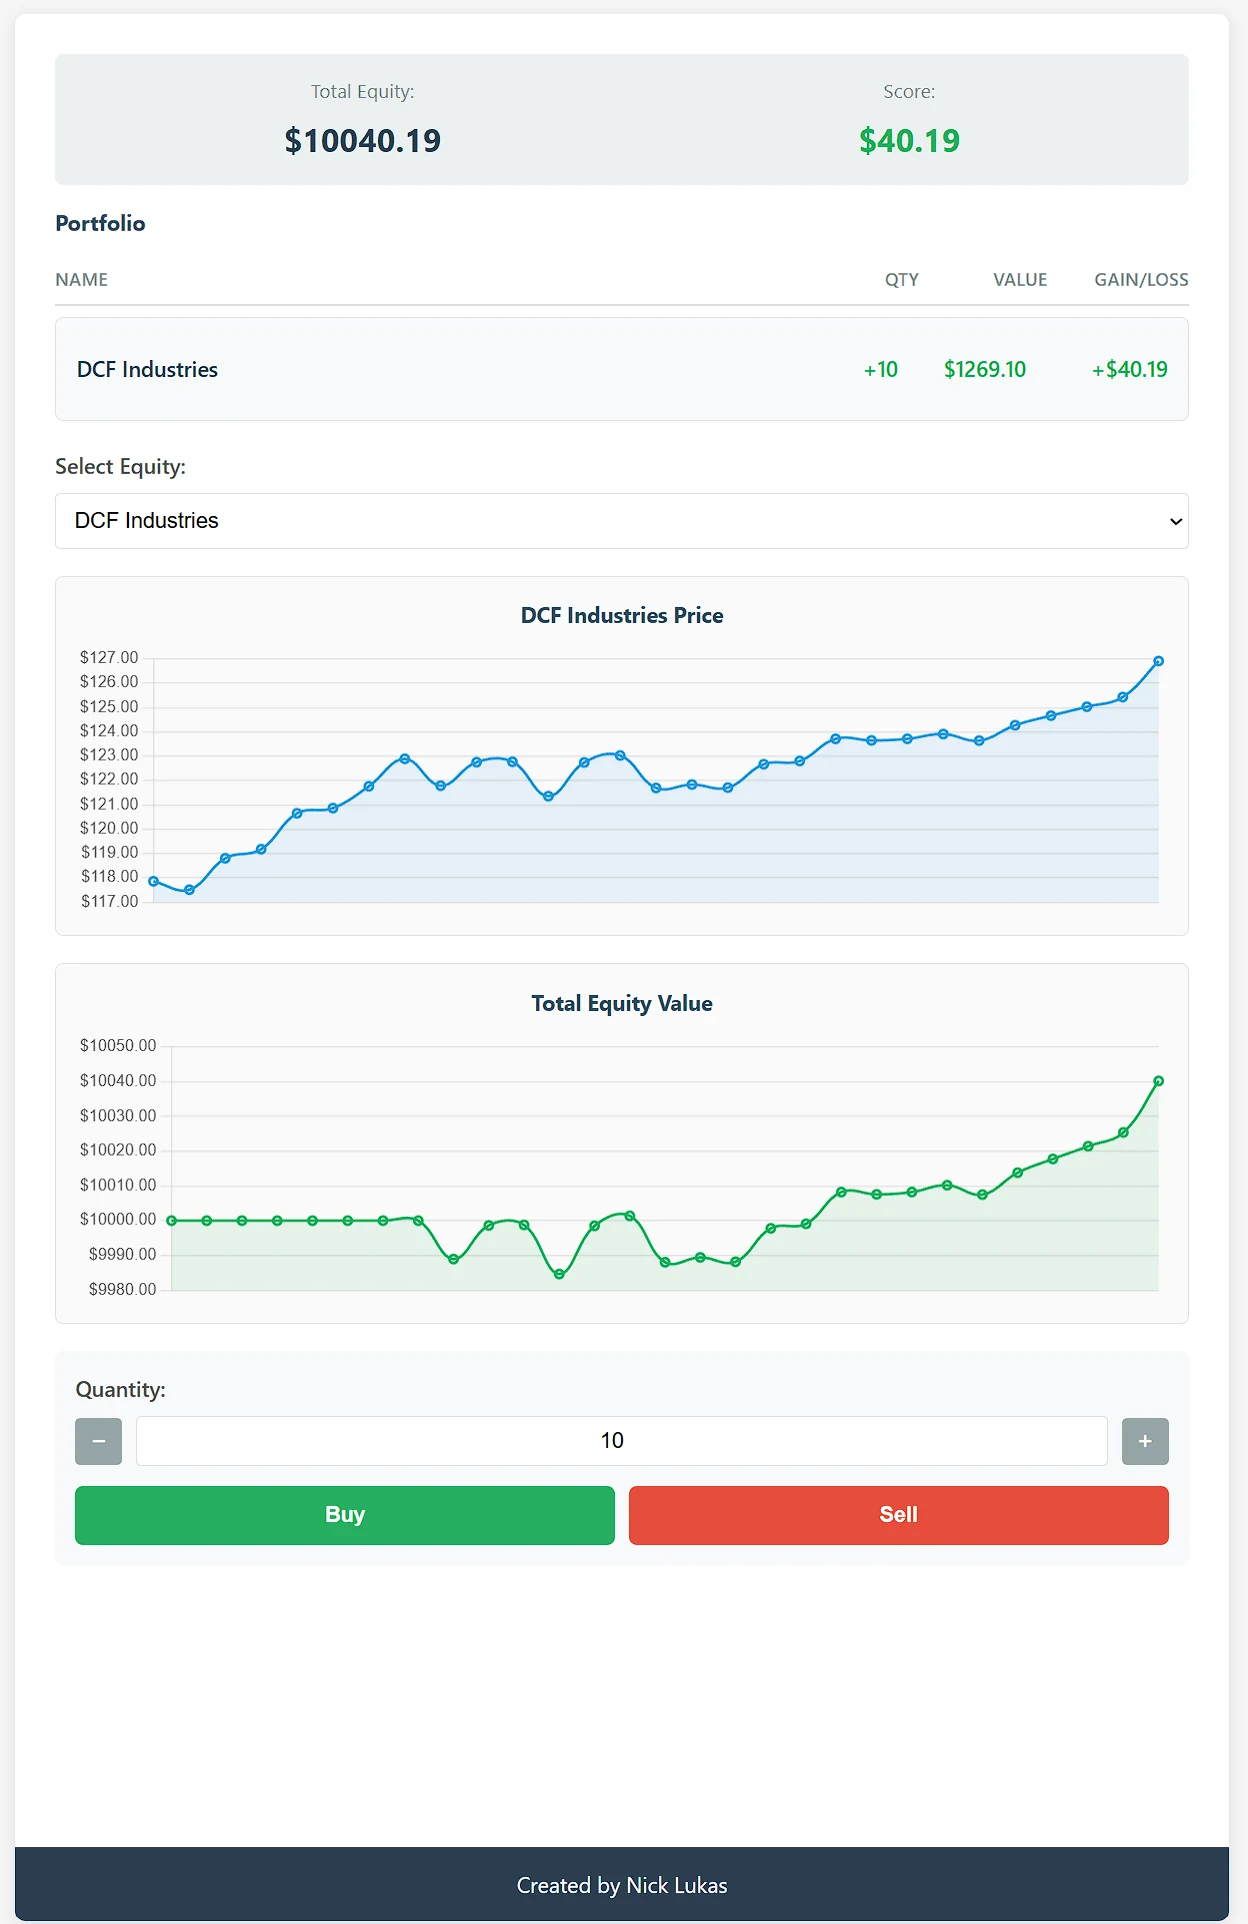
Each asset uses its own price behavior, drift, volatility, and randomized starting point.
Interactive project | Financial simulation
Trading Simulator
A browser-based market game with five fictional equities, continuously changing prices, long and short positions, live charts, and real-time net liquidation value.
Users can buy, sell, cover shorts, and see every trade reflected in account value.
Python runs through PyScript, while Chart.js renders the live price and equity charts.
Game concept
Turn $10,000 into $100,000 without reaching zero
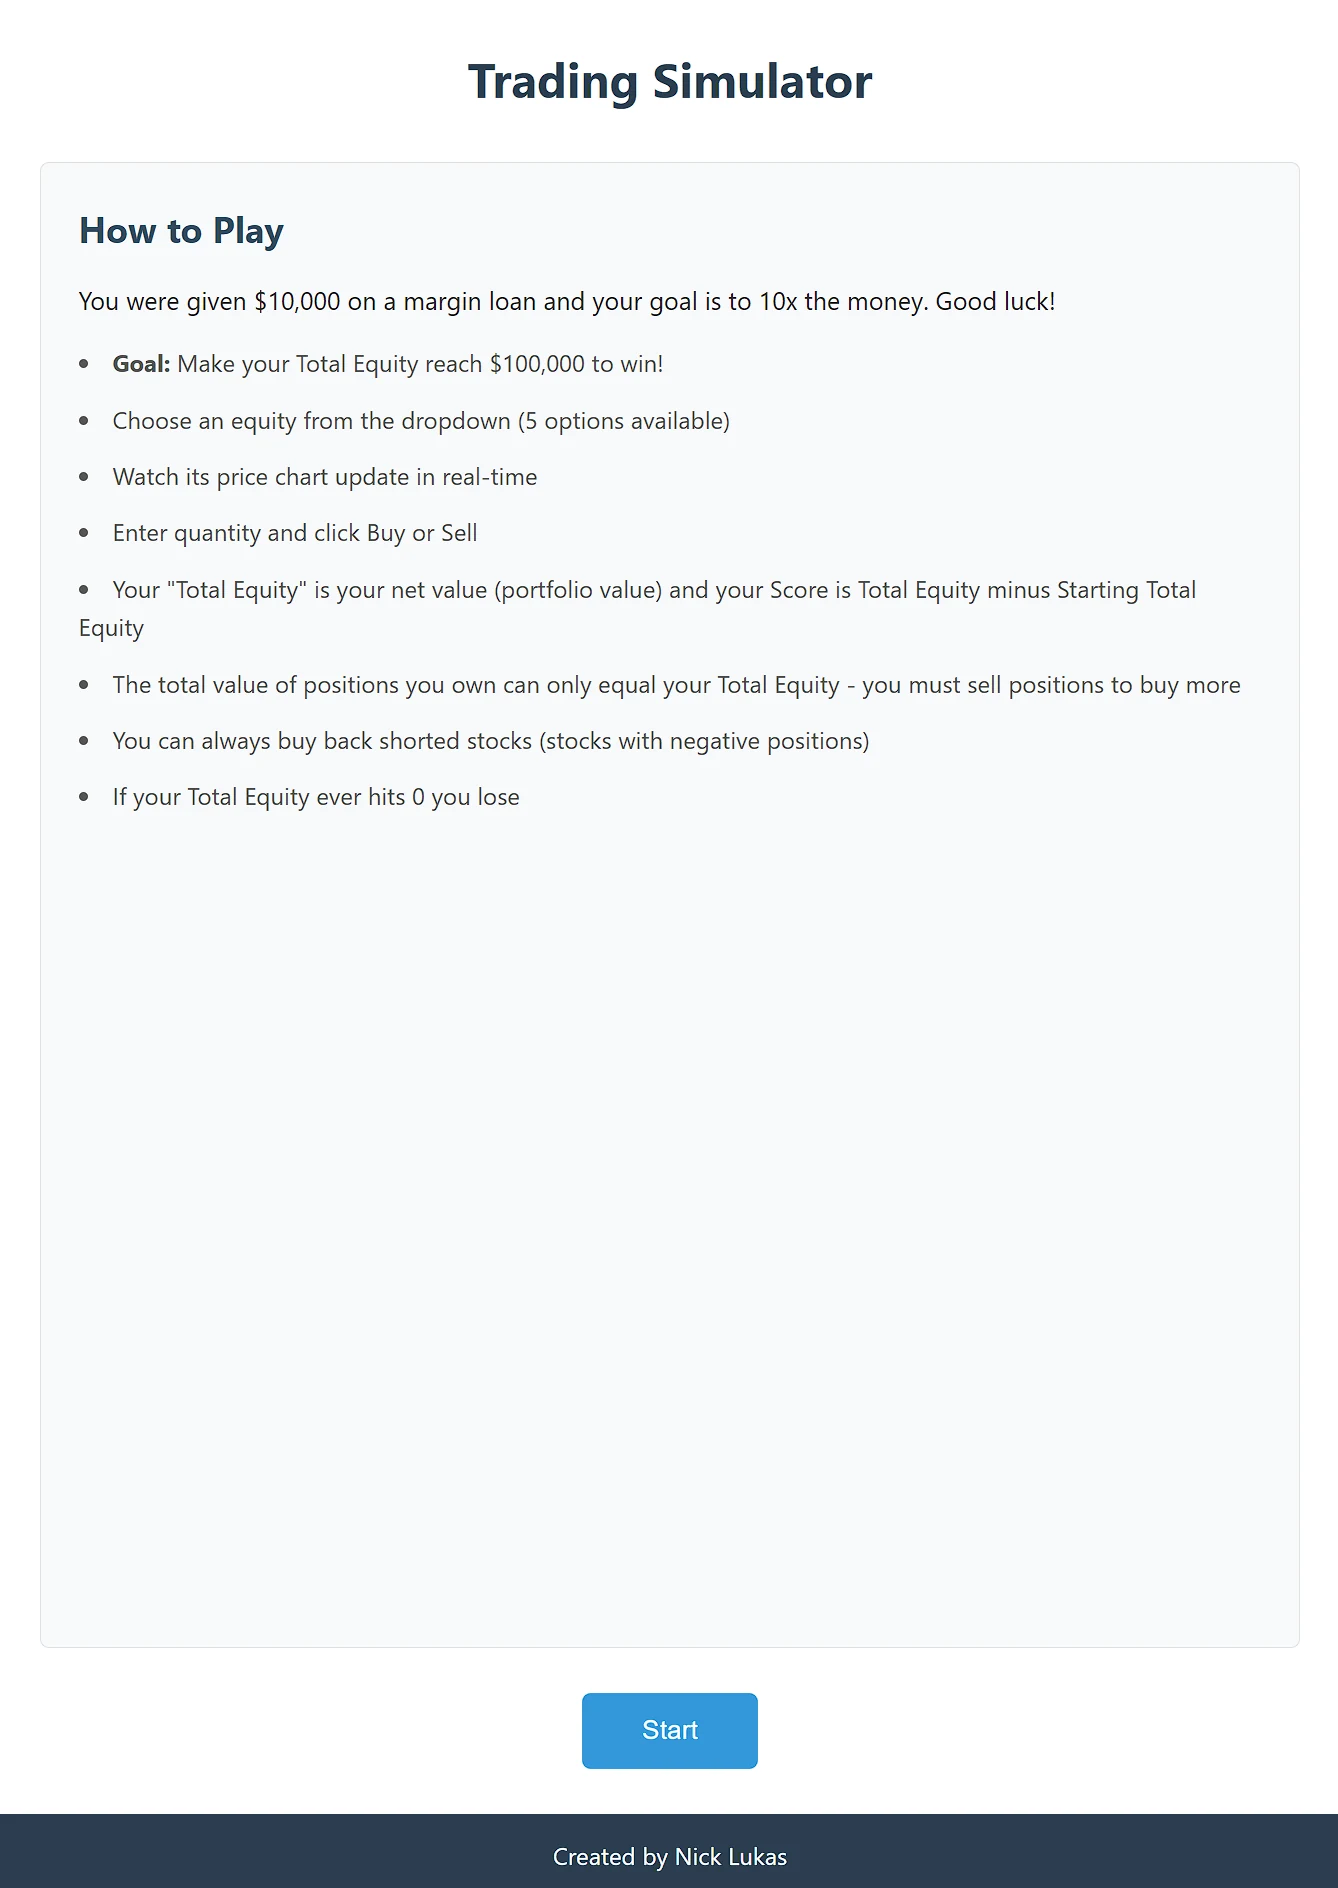
The player begins with a fictional, interest-free $10,000 margin loan. The objective is to increase total equity to $100,000. If total equity reaches zero, the run ends.
Core mechanics
- Select one of five fictional equities.
- Watch prices update once per second.
- Enter a quantity and buy or sell at the current simulated price.
- Hold positive quantities for long positions and negative quantities for short positions.
- Track total equity, score, portfolio quantities, position values, and gains or losses.
Fictional market
The simulator includes NL Co, Bank of Finance, DCF Industries, Walls and Streets Architecture, and AI Tech. Each asset is assigned different drift and volatility parameters, creating distinct price behavior across runs.
Price model
Prices are generated using Geometric Brownian Motion, a stochastic process commonly used to model financial prices. A random shock is combined with asset-specific drift and volatility each second.
S(t + dt) = S(t) x exp((mu - 0.5 sigma^2)dt + sigma sqrt(dt)Z)Prices are constrained to remain positive, and recent history is retained for charting.
Portfolio accounting
The application tracks a cash balance and a position quantity for every equity. Total account value is calculated as cash plus the market value of all positions.
Total equity = cash balance + sum(position quantity x current price)Short positions gain value when prices decline and lose value when prices rise. The score equals current total equity minus the $10,000 starting value.
Interface and architecture
The interface displays a selected-equity price chart, a total-equity chart, a live portfolio list, quantity controls, and buy and sell actions. The application is client-side, uses no external market feed or database, and does not persist between runs.
Scope and limitations
This is an educational simulation using fictional assets and generated prices. It does not model order books, liquidity, transaction costs, slippage, taxes, or real brokerage execution, and it should not be interpreted as investment advice or a performance forecast.
Live application
Open full simulatorRun the Trading Simulator
The embedded application is fully interactive. It can also be opened in a separate tab for a larger workspace.